Tuesday, July 24, 2012

Quantum process tomography

Quantum process tomography (QPT) is a useful technique for characterizing experimental implementations of quantum gates involving a small number of qubits. Recently, QPT has been used in a number of beautiful experiments with for example superconducting qubits [Bialczak2010][Dewes2012], nuclear spins [Steger2012], NV-centers [Fuchs2012], ion traps [Riebe2006], just to mention a few.

QPT can also be a useful theoretical tool, which can give insight in how a gate transforms states, and be used to study how noise or other imperfections deteriorate a gate. Whereas a fidelity or distance measure can give a single number that indicates how far from ideal a gate is, a quantum process tomography analysis can give detailed information about exactly what kind of errors various imperfections introduce.

In QuTiP, we have recently added support for computing and visualizing quantum process tomography matrices. Here we give a simple example that demonstrates these new functions for a few common one, two and three qubit gates. The gates in this example are all available in QuTiP's gate module.


"""
Plot the process tomography matrices for some 1, 2, and 3-qubit qubit gates.
"""
from qutip import *

gate_list = [['C-NOT', cnot()],
             ['SWAP', swap()],
             ['$i$SWAP', iswap()],
             ['$\sqrt{i\mathrm{SWAP}}$', sqrtiswap()],
             ['S-NOT', snot()],
             ['$\pi/2$ phase gate', phasegate(pi/2)],
             ['Toffoli', toffoli()],
             ['Fredkin', fredkin()]]

# loop though the gate list and plot the gates
for gate in gate_list:

 name  = gate[0]
 U_psi = gate[1]

 N = len(U_psi.dims[0]) # number of qubits

 # create a superoperator for the density matrix
 # transformation rho = U_psi * rho_0 * U_psi.dag()
 U_rho = spre(U_psi) * spost(U_psi.dag())

 # operator basis for the process tomography
 op_basis = [[qeye(2), sigmax(), sigmay(), sigmaz()] for i in range(N)]

 # labels for operator basis
 op_label = [["i", "x", "y", "z"] for i in range(N)]

 # calculate the chi matrix
 chi = qpt(U_rho, op_basis)

 # visualize the chi matrix
 qpt_plot_combined(chi, op_label, name)

show()
This program produces the following figures:

These figures are all examples of ideal quantum gates. To illustrate how the quality of a gate can deteriorate due to interaction between the qubits and their environment, let's consider a simple but experimentally realizable implementation of the two-qubit iSWAP gate. One way of implementing this gate is to produce the interaction Hamiltonian $H = g\left(\sigma_x\otimes\sigma_x + \sigma_y\otimes\sigma_y\right)$, and turn on this interaction for a period of time $T=\pi/4g$ [Schuch2003] [Steffen2006]. In the absence of noise and other imperfections, this procedure results in an ideal iSWAP gate to be applied to the two qubits. With QuTiP, we can easily simulate this process, and additionally study how and to what extent the gate deteriorates due to dissipation, imperfect switching of the interaction, detuning, etc. The following code demonstrates how to do this kind of analysis using QuTiP.

"""
Plot the process tomography matrix for a 2-qubit iSWAP gate.
"""
from qutip import *

g = 1.0 * 2 * pi # coupling strength
g1 = 0.75        # relaxation rate
g2 = 0.25        # dephasing rate
n_th = 1.5       # bath temperature

T = pi/(4*g)
H = g * (tensor(sigmax(), sigmax()) + tensor(sigmay(), sigmay()))
psi0 = tensor(basis(2,1), basis(2,0))

c_ops = []
# qubit 1 collapse operators
sm1 = tensor(sigmam(), qeye(2))
sz1 = tensor(sigmaz(), qeye(2))
c_ops.append(sqrt(g1 * (1+n_th)) * sm1)
c_ops.append(sqrt(g1 * n_th) * sm1.dag())
c_ops.append(sqrt(g2) * sz1)
# qubit 2 collapse operators
sm2 = tensor(qeye(2), sigmam())
sz2 = tensor(qeye(2), sigmaz())
c_ops.append(sqrt(g1 * (1+n_th)) * sm2)
c_ops.append(sqrt(g1 * n_th) * sm2.dag())
c_ops.append(sqrt(g2) * sz2)

# process tomography basis
op_basis = [[qeye(2), sigmax(), sigmay(), sigmaz()]] * 2
op_label = [["i", "x", "y", "z"]] * 2

# dissipative gate
U_diss = propagator(H, T, c_ops)
chi = qpt(U_diss, op_basis)
qpt_plot_combined(chi, op_label)

# ideal gate 
U_psi = (-1j * H * T).expm()
U_ideal = spre(U_psi) * spost(U_psi.dag())
chi = qpt(U_ideal, op_basis)
qpt_plot_combined(chi, op_label)

show()

The code produces the following figures (the ideal iSWAP gate to the left, the dissipative one to the right):

Note: the quantum process tomography functions were added after the 2.0 release, so to run these examples you need to get the latest development version of QuTiP from the SVN repository. Alternatively, if you prefer to stay on the official release (recommended for stability), you can download this file and put it in the same directory as the example code and add "from qpt import *" at the top of the example files (just below the line "from qutip import *").

Friday, July 20, 2012

Monday, July 2, 2012

How large quantum systems can QuTiP handle?

People are often curious to know how many qubits can be simulated on a modern computer, using for example QuTiP. The primary focus of QuTiP is not to manage as large quantum systems as possible, but we do try to make QuTiP efficient, and it is useful to have some feeling for how large systems we can manage.
The answer to the question posed in the title depends strongly on the type of the problem. For example, whether the Hamiltonian is constant or time-dependent, the system is closed or open, states are pure or mixed. Ultimately it is the RAM memory that limits the size of the systems we can manage, but in some cases you are likely to run out of patience long before the RAM memory is exhausted (in particular for time-dependent systems).
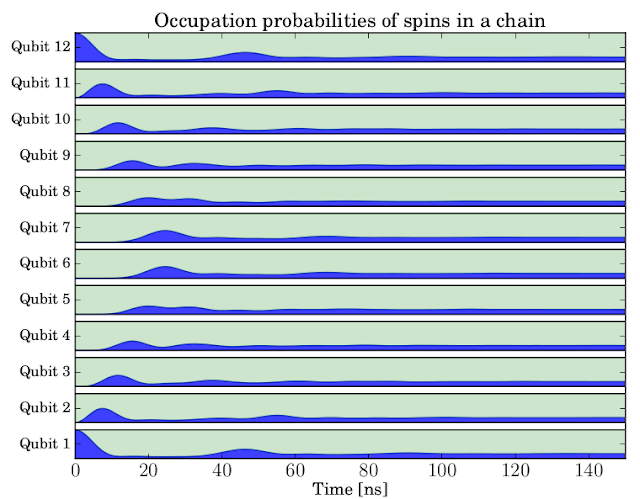
Computationally, the simplest problem that QuTiP will typically be used for is the evolution of a closed quantum system with a constant Hamiltonian. To explore how large quantum systems of this kind we can simulate with QuTiP, let’s consider a chain of spins coupled to their nearest neighbors through a sigma-x interaction. In QuTiP it is easy to program this model in a way that parameterize the number of spins in the chain, allowing us to simulate systems with increasing number of spins until we run out of RAM memory (resulting in a MemoryError exception being raised by python) or until we run out of patience. You can find the program code here:

"""
QuTiP example: Dynamics of a spin-1/2 chain
"""
from qutip import *
from pylab import *
rcParams['text.usetex'] = True
rcParams['font.size'] = 16
rcParams['font.family'] = 'serif'

def system_ops(N, h, J, gamma):

    si = qeye(2); sx = sigmax(); sz = sigmaz()

    sx_list = []; sz_list = []
    for n in range(N):
        op_list = [si for m in range(N)]
        op_list[n] = sx
        sx_list.append(tensor(op_list))
        op_list[n] = sz
        sz_list.append(tensor(op_list))
        
    # construct the hamiltonian
    H = 0
    for n in range(N):
        H += - 0.5 * h[n] * sz_list[n]                # energy splitting terms
    for n in range(N-1):
        H += - 0.5 * J[n] * sx_list[n] * sx_list[n+1] # interaction terms

    # collapse operators for spin dephasing
    c_op_list = []
    for n in range(N):
        if gamma[n] > 0.0:
            c_op_list.append(sqrt(gamma[n]) * sz_list[n])

    # intital state, first and last spin in state |1>, the rest in state |0>
    psi_list = [basis(2,0) for n in range(N-2)]
    psi_list.insert(0, basis(2,1)) # first
    psi_list.append(basis(2,1))    # last
    psi0 = tensor(psi_list)

    return H, c_op_list, sz_list, psi0

def evolve(N, h, J, tlist, gamma, solver):

    H, c_ops, e_ops, psi0 = system_ops(N, h, J, gamma)
    output = solver(H, psi0, tlist, c_ops, e_ops)
    return (1 - array(output.expect))/2.0 # <sigma_z> to excitation prob.

# ---
solver = mesolve              # select solver mesolve or mcsolve
N = 16                        # number of spins
h =  1.0 * 2 * pi * ones(N)   # energy splittings
J = 0.05 * 2 * pi * ones(N)   # coupling
gamma = 0.0 * ones(N)         # dephasing rate
tlist = linspace(0, 150, 150)

sn_expt = evolve(N, h, J, tlist, gamma, solver)

# plot excitation probabilities for each spin
yvals = []
ylabels = []
for n in range(N):
    x = 0.1 # spacing between stacked plots
    p = real(sn_expt[n]) * (1-2*x)
    base = n + zeros(shape(p)) + 0.5 + x
    plot(tlist, base, 'k', lw=1)        
    plot(tlist, base+(1-2*x), 'k', lw=1)        
    fill_between(tlist, base, base + p, color='b', alpha=0.75) 
    fill_between(tlist, base + p, base + (1-2*x), color='g', alpha=0.2)
    yvals.append(n + 1)
    ylabels.append("Qubit %d" % (n+1,))

autoscale(tight=True)
xlabel(r'Time [ns]',fontsize=14)
title(r'Occupation probabilities of spins in a chain', fontsize=16)
yticks(yvals, ylabels, fontsize=12)
savefig('spinchain-%d.pdf' % N)
In this simulation, we initially put excitations at the spins at the end of the chain and evolve the state vector. The result shows how the excitations propagate in the spin chain and eventually disperse.
My patience ran out after 21 spins. This corresponds to a very large quantum state space, 2’097’152 states to be exact, which is a quite impressive number. But admittedly, this simulation took a long time to run: About 7 hours on my laptop, and the memory usage peaked at about 4.3 Gb of RAM.
Open quantum systems are significantly more computationally demanding to evolve. First, we need to use the density matrix rather than a state vector to describe the system, which immediately squares the problem size. Second, the equations of motion (Master equation) are more complicated, including for example superoperators, requiring us to rearrange the equations of motion to obtain an ODE on standard form (of squared system size). Alternatively, we can use a stochastic equation of motion, such as the quantum trajectory Monte-Carlo method, and circumvent the requirement to square the system size, but this also comes at a steep price as we then need to average a large number of trajectories with the original system size. Regardless if we use a master equation or the Monte-Carlo quantum trajectory method, we cannot hope to evolve as large systems as we could for a closed quantum system.
Including dissipation in the example program above (by selecting gamma=0.0025), I could simulate systems up to 12 spins before the RAM memory was exhausted (on a 16Gb desktop). The 12 spin simulation took a weekend to run, and the peak memory usage was about 20 Gb (temporarily swapping 4 Gb). On this computer, further increasing the system size would result in memory error when using the master equation solver. Using the Monto-Carlo solver (by setting solver=mcsolve in the code) I could simulate open systems up to 16 spins in a similar time period (a few days).
If we include a time-dependence in for example the Hamiltonian, the memory foot-print is not significantly altered, but the problem becomes more CPU demanding, increasing the simulation time by sometimes quite a lot. However, at least in principle, we can simulate time-dependent quantum systems of similar size as time-independent problems.

Friday, June 29, 2012

QuTiP: The First Year

Although the first version of QuTiP wasn't released until July 29, 2011, the Goggle Code repository and website has been officially active for one year now! On this one year anniversary, I thought I would share some of the statistics about QuTiP that have been collected:

# of Downloads: 1,000+
(we lost the ability to keep track with the new webpage layout)
# of Citations: 2
Unique Vistors: 2,036
Total Visits: 9,261
Pages Viewed: 43,253
# of Countries: 74
Number of QuTiP visitors from various cities around the world.

Both Rob and I are quite happy with the way QuTiP has been accepted, and hope that people are finding these tools to be useful.

Monday, June 25, 2012

The Basis of Errors

Numerical simulations are never perfect.  Of course, the fundamental reason for this is the limit set by floating-point numbers.  However, more often than not, it is an error made by the user in coding their problem that leads to the primary source of error in a calculation.  Here, we will look at one such error by considering the dynamics of a driven system composed of two-coupled oscillators.  Here we drive oscillator B with a classical drive, and assume the initial state is both oscillators in the ground state.  The QuTiP code, and resulting plot is given below: 

"""
Driven system of two-coupled harmonic oscillators
"""
from qutip import *
from pylab import *

wa  = 1.0 * 2 * pi   # frequency of system a
wb  = 1.0 * 2 * pi   # frequency of system a
wab = 0.2 * 2 * pi   # coupling frequency
ga = 0.05 * 2 * pi    # dissipation rate of system a
gb = 0.05 * 2 * pi    # dissipation rate of system b
Na = 7              # number of states in system a
Nb = 7              # number of states in system b 
E= 1 * 2 * pi
a = tensor(destroy(Na), qeye(Nb))
b = tensor(qeye(Na), destroy(Nb))
na = a.dag() * a
nb = b.dag() * b
H = wa*na+wb*nb+wab*(a.dag()*b+a*b.dag())+E*(b+b.dag())

# start with both oscillators in ground state
psi0 = tensor(basis(Na), basis(Nb))
#construct collapse operators
c_op_list = []
c_op_list.append(sqrt(ga) * a)
c_op_list.append(sqrt(gb) * b)

tlist = linspace(0, 5, 101)

#run simulation
data1 = mesolve(H,psi0,tlist,c_op_list,[na,nb])

#plot results
plot(tlist,data1.expect[0],'b',tlist,data1.expect[1],'r',lw=2)
xlabel('Time',fontsize=14)
ylabel('Excitations',fontsize=14)
legend(('Oscillator A', 'Oscillator B'))
show()

Fig1: Coupled oscillator evolution.

Now, looking at the plot, we see that the results are what we would expect intuitively from our initial setup.  Since we drive oscillator B, we would expect the number of excitations in B to grow large before the coupling with oscillator A starts to drive energy into this mode.  At later times, we see that the energy goes back and forth.

If this graph was in a publication, chances are it would pass the referees just fine.  Especially if we are like everyone else and do not attach the source code for this plot!  However, the graph above is in fact wrong.  Our model is correct, so qualitatively it gives reasonable answers.  However, quantitatively it is off at some times by over 100%!  So where did we screw up?  In our initial setup, we chose to have N=7 states for both of our resonators.  If we were naive, then looking at the plot, we might assume that this is a big enough Hilbert space since we have at most ~3 excitations in any given oscillator.  Fortunately for us, we paid attention in class, and we remember that an harmonic oscillator driven by a classical drive tends to produce coherent states, and a coherent state has a Poisson distribution over a wide range of number states.  Therefore, in choosing only 7 states, we are in fact chopping off some of the system dynamics.  Since this truncation will be most pronounced when the system has the largest number of excitations. lets look at what a more accurate model with N=10 states gives us at time t=0.50 for oscillator B:
Fig.2: Distribution for oscillator B at t=0.50
overlaid with coherent state distribution.
Blue states are truncated when N=7.

From Fig. 2, we can immediately see the error.  We are effectively ignoring the contributions from the higher modes (blue) of the generated (nearly) coherent state when N=7.  It should not be surprising that the results at later times are not correct.  Including more states (N=10) gives the following results.

Fig 3.: Comparison of dynamics with N=7 and N=10 states.

In this case, the average error is 22.4%, and as alluded to earlier, is over 100% at some time-steps.  We can look at the error between the data for N states vs. N-1 as we increase N:

Fig. 4: Error between data for N and N-1 oscillator states.

We can see that the error begins to level off starting around N=10, where the increase in the number of oscillator states has little effect on the numerics.

The final message: Check to see if the number of states you are using is in fact large enough by visually checking the effect of adding more states, or better yet, plotting the error as a function of system size.  And as always, include your code in your publications.  

Tuesday, June 19, 2012

Why Release Your Source Code?

(and an example)

Science is all about reproducibility.  Twenty to thirty years ago, this usually meant reproducing the experimental results of another group, or verifying a series of calculations from a paper.  With the rapid expansion of computing power, and the push to ever more sophisticated models, these days it is extremely rare to find a paper that does not include some form of computer calculation/simulation.  Yet at the same time, the ability to reproduce simulation results is hampered by the fact that almost no one releases the computer code for their papers. When looking at a simulation plot from one of these papers, you cannot be sure whether the answer presented is in fact valid.  Perhaps they missed a factor of 2, maybe worse? Moreover, in some fields such as cosmology, the output of computer programs provides the only incite into physical processes that are out of reach to experimentalist, thus making the validation of the underlying computer codes a top priority.  However, regardless of the field, the release of numerical codes, along with analytical results, is needed for complete transparency and validation of published research.  Recently, this issue has started to receive some much needed attention.  The latest article came out at the beginning of this year:


highlighting the importance of transparent code, and giving some interesting counter examples that resulted in a number of errors.  Some other related articles can be found here:


In 2010 we started QuTiP with the goal of being a completely open-source, numerical simulation package for quantum mechanics research and education.  Being based on the Python programming language and the SciPy and NumPy packages means that the user has access to every single line of code used in the simulation. Contrast this to the quantum optics toolbox where, although the toolbox itself is open-source, the Matlab code on which it runs is surely not.  The propriety nature of the algorithms used in commercial software provides an additional barrier to scientific reproducibility (not to mention they cost some serious money).

Example: (updated 28/06/12)

We fully encourage QuTiP users to help further the reproducibility of computational science and release their source code in their publications, or possibly submit it to us as a demo.  Here we highlight one such example kindly given to us by Catherine Holloway at the IQC in Waterloo.  From the authors own mouth:

----
This code allows us to compare simulations of QKD to experimental
results, for example, we have done this in these papers:

http://arxiv.org/abs/1109.2519
http://arxiv.org/abs/1007.4495

In addition, this allows us to test how long QKD with entanglement can
go, for example, between the ground and a satellite, with different
configurations of detectors, and for telecommunications optical fiber
links.

We are currently using this simulation to develop a model for the
optimal squeezing parameter for any channel efficiency and background
noise, and the resulting secure key rate and two-fold coincidence
rates for this optimal squeezing parameter. In many real-world
implementations, such as a satellite link, the background count and
loss fluctuate randomly over the course of a link, and being able to
re-adjust the power level of the source (and thus the squeezing
parameter) in real-time based on the current values of efficiency and
background would be a great boon.
----

The QuTiP file is somewhat lengthy so we have attached both html and Python versions as separate links:


The output from this example, giving the key and bit error rates as a function of loss is given below.

Thursday, June 14, 2012

Launchpad PPA for QuTiP releases

Installing QuTiP on Ubuntu just got a lot easier. Using our new PPA on Launchpad, QuTiP and all its dependencies can now be installed using the following commands:
$ sudo add-apt-repository ppa:jrjohansson/qutip-releases
$ sudo apt-get update
$ sudo apt-get install python-qutip
On a desktop/laptop system you'd probably also want to install the package texlive-latex-extra:
$ sudo apt-get install texlive-latex-extra
For subscribers of the qutip-release PPA, new releases of QuTiP will be automatically available through the Ubuntu update manager.
There is also a PPA called qutip-trunk, which provides access to daily builds of the latest development version of QuTiP.